

At BFP, due to our focus on early-stage emerging managers, we have multiple conversations with young talents who are still building their track record. When evaluating early-stage funds, the value of the most common performance metrics such as TVPI ratio, MOIC, and IRR is low in the first years of the life cycle of a fund.
Given that for most emerging managers the track record is either inexistent or too early to assess, if we used only these metrics to assess new opportunities, we would have a very limited view.
For this reason, we think about which other quantitative aspects we can add in our assessment.
If we did not do this, we would certainly miss the overall picture as well as great investment opportunities.
Explanation of the Paradox
Among the metrics that we look at in a track record, we think that there are two that have a quite interesting relationship:
– The Seed to Series A Graduation rate
– The Write Off Rate
In some public resources, we found out that both seem to be positively correlated with performance (i.e. TVPI ratio). If this was completely true, we would expect the relationship between performance, graduation rate and write off rate to be as shown in the chart below:
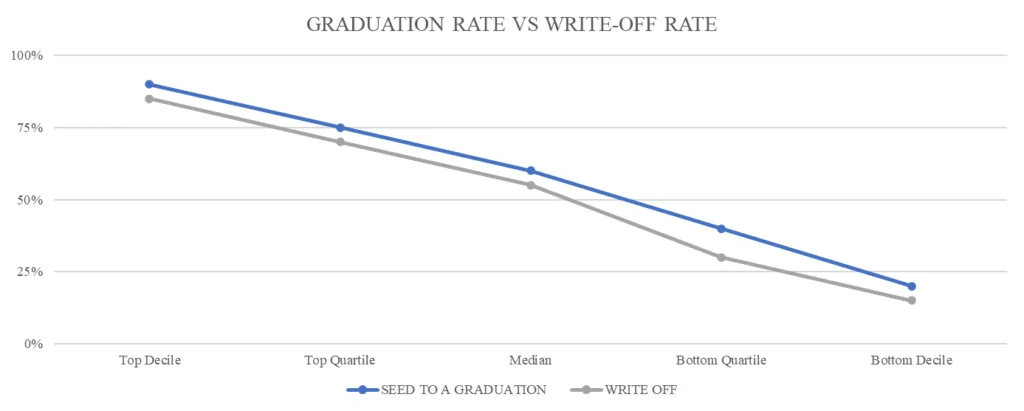
Apparently, this positive correlation for both variables does not make sense, as:
– On one side, the more the portfolio raises follow on rounds, the better the performance
– On the other side, the performance also improves when more companies fail
How is this possible?
The case for the Seed to Series A Graduation Rate
This metric is calculated as the ratio between the number of Seed investments that raise a subsequent Series A round and the number of total Seed investments.
Basically, the concept is that when a company converts to Series A, then the value of the investment increases. Consequently, the more companies convert to Series A, the higher the value of the entire fund should be. This is why managers focus on this metric in their pitches as well as in their portfolio activity (i.e. helping their companies to raise a new round).
But is the Seed to Series A graduation rate actually a good proxy of performance or is it just a myth? A complete assessment of this question would require a statistical analysis (which is not the purpose of this article), but here we just want to challenge this thinking and share some of our insights.
Our internal discussion was driven by two central arguments, each supporting a different side of the paradox.
The supporting argument we found was actually based on some interesting data from Dealroom![]() .
.
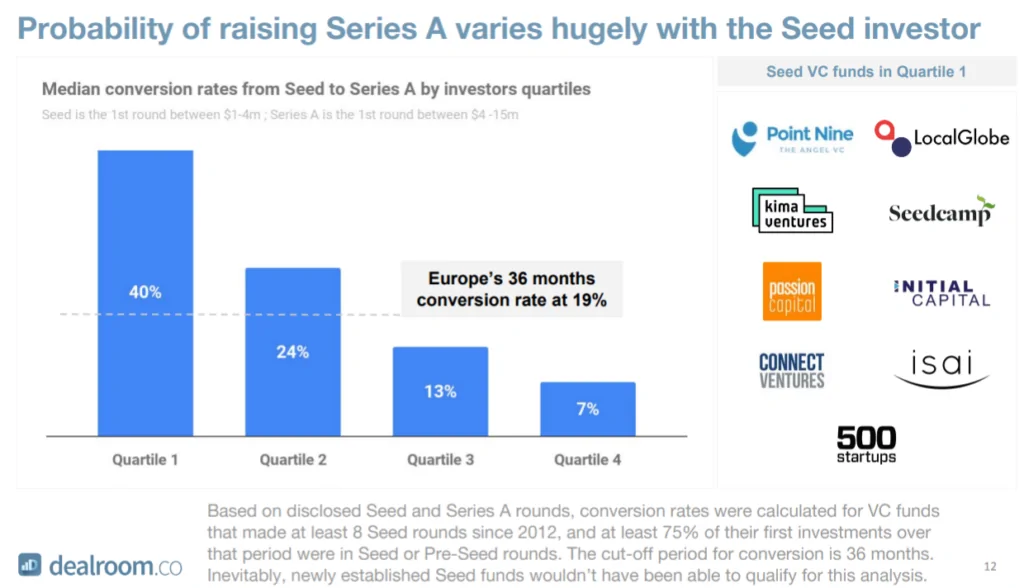
This chart shows the median conversion rates from Seed to Series A by investor quartiles.
According to this report, the better an investor is, the higher the median conversion rate will be.
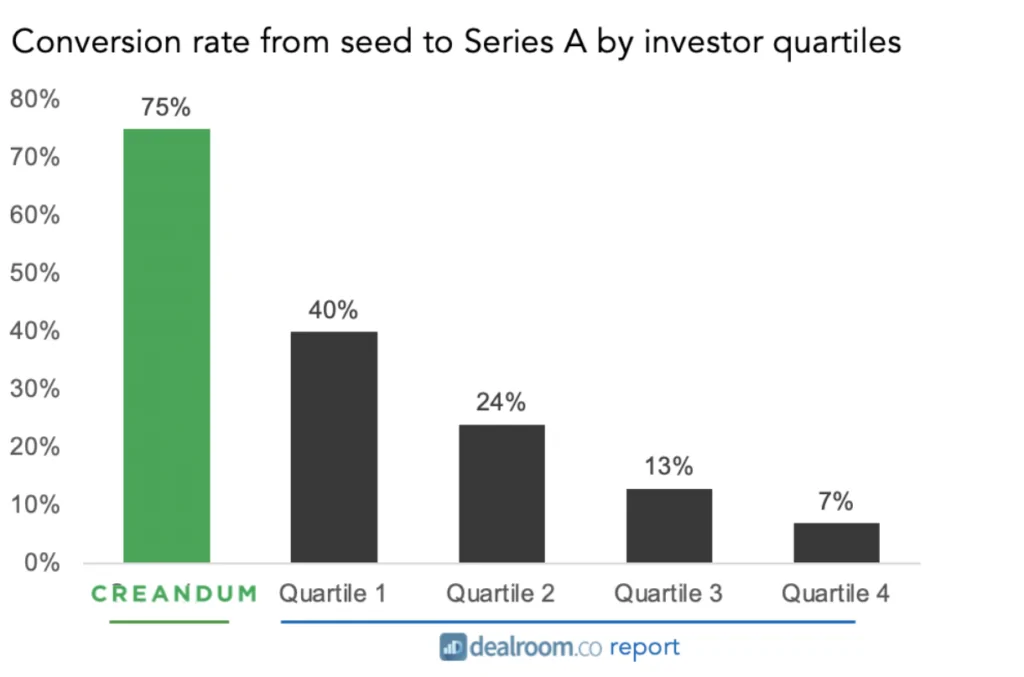
Indeed, the top quartile funds shown in the slide are well established brands in the European ecosystem and some of them (Seedcamp, Kima) even published their performance, which is objectively very strong. Even Creandum, one of the most prolific investors in Europe, shared an article stating its Seed to Series A graduation rate.
Based on this, the graduation rate appears to be a good proxy for performance.
The Case for the Write-Off Rate
On the other side, when discussing internally about graduation rates, we stumbled upon a completely different metric: the write-off rate.
This metric is calculated as the ratio between the number of write-offs (i.e. companies that are closed / shut down) and the number of total investments.
Also in this case, managers pitch this number quite often as they believe that the lower the write off-rate is, the higher will be the performance. The curious reality of venture capital is actually quite different from what many managers assume: As Andrew Chen (a16z) explains in this outstanding article, “good” 2-3x fund and a fantastic >5x fund lose money about the same % of the time”. Looking at the data from the article and shown below, >5x funds have a higher write off rate than >3x-5x funds and >2x-3x funds.
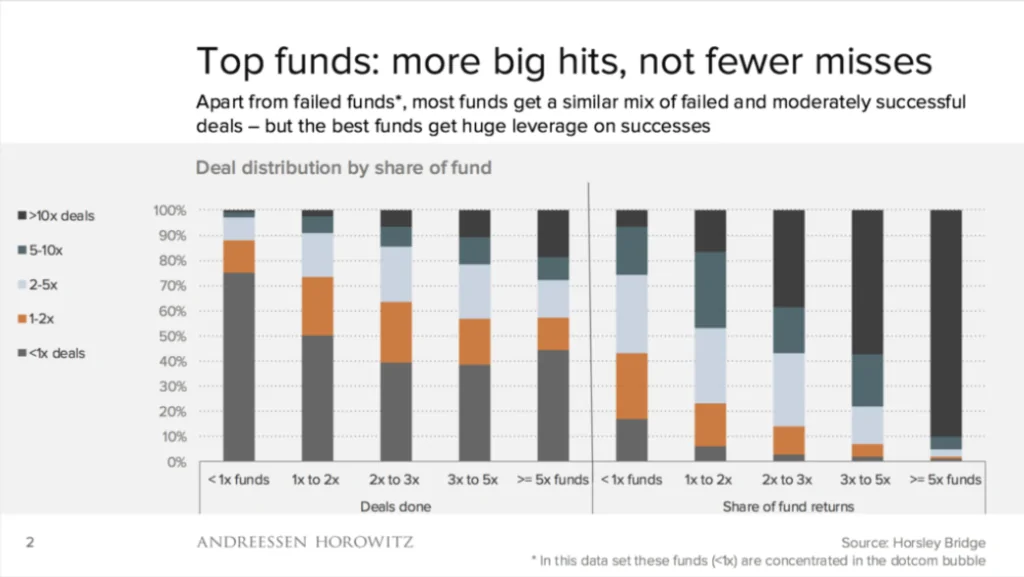
Why is this strange? Because it seems that the more startups in a portfolio fail, the better that portfolio will perform. How can this make sense?
Benedict Evans provides an answer here mentioning “the ‘Babe Ruth effect’ – you take more risks to get the best returns (..) Venture funds invest in a particular type of startup, one that is much more likely to go to zero, but which has the potential, if it does succeed, to produce something very big”
Basically, funds with a lower write-off rate do not perform outstandingly because they do not take enough risk, as “a fund gets better returns by having more really big hits, not by having fewer failures”. The more risk you take, the more startups in your portfolio will fail, but the more the winner will outperform.
The Resolution of the Paradox
To summarize, when discussing the quality of the Seed to Series A conversion rate as a proxy of performance, we had two opposite arguments:
– On one side, some high performing European Seed funds have a very strong Seed to Series A conversion rate
– On the other side, top performing funds have a high write-off rate, which is basically the opposite of the graduation rate
It seems that performance is correlated with both the share of startups in a portfolio that raise a new round as well as with the share of startups that fail.
Our take is that, as curious as it sounds, this is not a paradox as the two arguments are not necessarily mutually exclusive.
Good funds could have both high conversion rates as well as high write-off rates.
To check this, we had a look at some insights from our portfolio.
We collected data from 7 mature funds from the 2015 vintage, ranked them based on Net TVPI ratio from 1-7 (top-bottom) and gathered information on their graduation and write-off rates.
The chart below shows the data we collected:
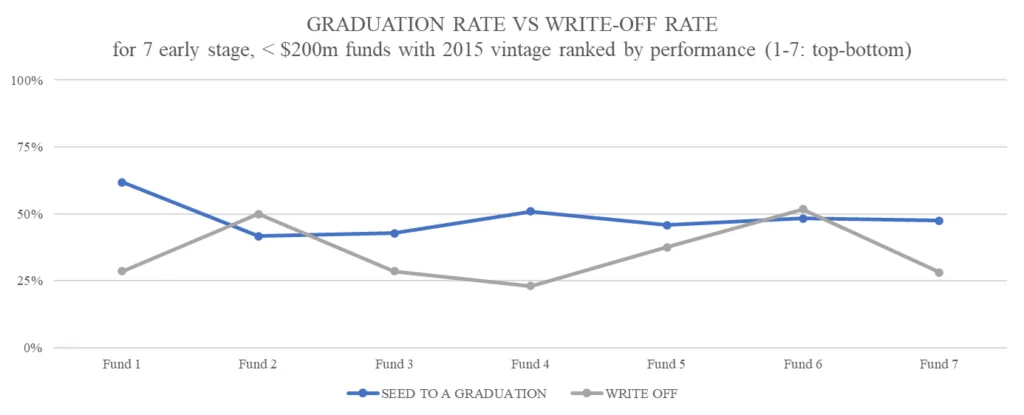
Curiously, the two curves are completely different from what we would expect, but, we still can extract some relevant insights:
– On the graduation rate, there is no clear correlation with performance, but there are signs that top performing funds could show a higher graduation rate
– The write-off rate is more interesting as its pattern is not linear:
– The top performing fund has the same write-off rate as the bottom one, which is also the same as the average
– However, for the funds which are between the average and either the top or the bottom, the write off rate is the same and higher than average
– Based on this, it is difficult to predict the performance based on the write-off rate
Basically, the main point is that the correlation between TVPI ratio, graduation rate and write-off rate is not that clear. What could be the reasons?
Our take is that other factors also impact significantly the TVPI ratio as well as its relationship with the two metrics, and therefore the correlations described above can not be considered in absolute terms. Some of these factors are:
– Fund size
– Reserve strategy
– Ownership stakes
– Portfolio concentration
– Exact stage of initial investment (e.g. Pre-Seed vs Series A)
– Value concentration in one, few or more companies
– Absolute value of the main drivers
– Deployment pace
– Sector focus (e.g. deeptech/hardware vs consumer software)
– Value add approach (hands on vs hands off)
Conclusions
In conclusion, we can say that the write-off rate is difficult to interpret, but a very, very strong graduation rate actually signals high performance.
Clearly, such insights would need further investigation with a broader data set, but we think it is useful for the VC community to foster a discussion around the topic and share some perspectives from the LP side.
Join us over at Linkedin to continue the conversation. We’re interested in hearing your thoughts and comments.
—
Authors
About Danchun Chen
Danchun joined Blue Future Partners as an Analyst in 2020 as part of the research team. She is fascinated by the great impact of venture capital and tech startups on the future economy at a global scale. Before joining BFP, she spent time in Strategy Consulting, Startups and Venture Capital across China, France, Singapore, India and Switzerland.
Danchun holds a Master in Management from EDHEC Business School in France and a Bachelor of Arts from South China Normal University.
Linkedin
About Marco Cesare Solinas
Marco is an Analyst at Blue Future Partners, where he is responsible for sourcing and analysing new investment opportunities. He is passionate about Technology and Venture Capital and making an impact with investments. He focuses on both direct and indirect investments.
Previously, he has built an international and multicultural background across Italy, US, Germany, Turkey and Malaysia. Marco holds a CEMS Master’s in International Management and a Bachelor´s in Economics and Finance from Bocconi University.
Linkedin — Twitter — Medium